A pig farm can generate revenue.
Revenue alone does not tell you whether the operation is a good investment.
You need to understand how production volume grows, how mortality affects saleable output, how feed and veterinary costs behave, how selling prices evolve, how much capital is required, how financing impacts cash flow, when profitability is reached, how quickly capital can be recovered, and what happens if growth disappoints or costs rise.
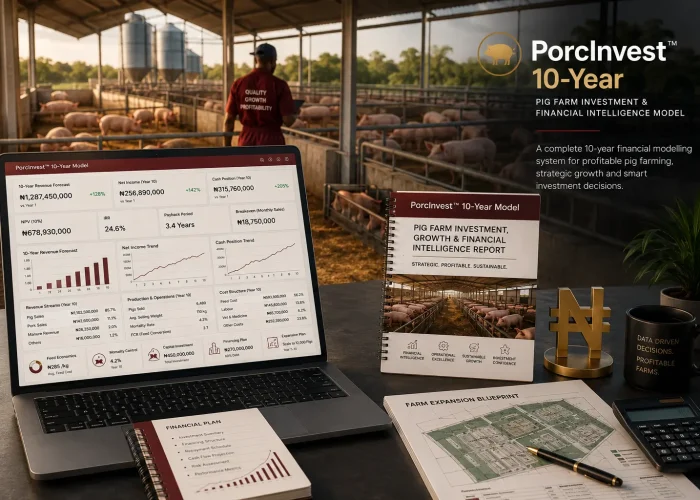
PorcInvest™ 10-Year brings all of these questions together in one structured financial modelling environment. It takes realistic pig-farm economics and extends them into a full 10-year investment perspective.
Pig-Farm Economics Built Into the Model
Define up to 10 revenue streams, including Mature Pigs, Pork (kg), Dry Manure and additional custom products. Each line supports quantities, unit costs, selling prices, growth, price changes, sales-start timing and mortality adjustment — so projected revenue reflects real production losses.
The cost structure is purpose-built for pig production:
Feed inputs (Palm Kernel Cake, blood meal, cassava peel, maize chaff, firewood, leaves)
Animal health (vaccination, veterinary services)
Farm operations (water, salaries, rent, marketing, utilities, transportation, maintenance, insurance, owner’s wage)
Fully customisable additional expense lines
Infrastructure & Financing Are Part of the Story
Model capital assets such as land, chambers/pens, water tanks, borehole, vehicles and furniture with depreciation and purchase timing. Include realistic loan assumptions (amount, interest rate, duration, moratorium) so you can compare internal versus borrowed capital growth.
Three Possible Futures
Base — Your expected operating case
Optimistic — Higher volume growth and more favourable costs
Pessimistic — Lower growth and higher costs
Editable scenario multipliers let you stress-test the farm without overwriting your core assumptions.
Dual Time Horizon
10-Year Annual View — Revenue, costs, capital expenditure, financing, cash flow, profitability, assets, liabilities and equity across a full decade.
36-Month Monthly Engine — Detailed monthly cash-flow sheets for Year 1, Year 2 and Year 3 plus a 36-Month Summary. Liquidity pressure almost always appears in the early years; this model lets you examine it properly.
The Executive Dashboard & Investment Metrics
Select any year and product to instantly view Total Sales, Gross Profit, Net Income, Ending Cash, Total Assets, Loan Outstanding — plus:
NPV (with terminal value)
Approximate IRR
Payback Period
Illustrative Breakeven Revenue & Quantity
Integrated Financial Statements
Full 10-Year Profit & Loss and Balance Sheet (with balance check) turn the model from a farm budget into a proper long-term financial asset view.
Core Promise
Don’t just count pigs. Model the business behind them.
Because a successful pig farm depends on feed economics, mortality, selling prices, infrastructure, working capital, financing, operating costs, cash flow, growth — and ultimately return on capital.